
Random Tricks
Published: December 07, 2019
Note: Below tricks are a reminder to myslefy how I solved the problem at the time . . .

Table of Contents
- Find words with forward slash
- Pie & Count Plot
- Stacked & Parallel Bar Plot
- Boxplots
- Numerical Data EDA
- Generate Sample DataFrame
- args & kwargs
- Zip unzip
Find words with forward slash
string_val="my name is a/c what can u do?"
string_val
'my name is a/c what can u do?'
Start with finding Slash & space after the slash
string_val.find(" ",string_val.find("/"))
14
string_val[:string_val.find(" ",string_val.find("/"))]
'my name is a/c'
find the space before the slash by rfind
string_val[:string_val.find(" ",string_val.find("/"))].rfind(" ")
10
string_val[:string_val.find(" ",string_val.find("/"))]\
[string_val[:string_val.find(" ",string_val.find("/"))].rfind(" "):].strip()
'a/c'
Tricks-2
import numpy as np
import pandas as pd
import matplotlib.pyplot as plt
import seaborn as sns
%matplotlib inline
df=pd.read_csv('StudentsPerformance.csv')
df.shape
(1000, 8)
df.head()
| gender | race/ethnicity | parental level of education | lunch | test preparation course | math score | reading score | writing score | |
|---|---|---|---|---|---|---|---|---|
| 0 | female | group B | bachelor's degree | standard | none | 72 | 72 | 74 |
| 1 | female | group C | some college | standard | completed | 69 | 90 | 88 |
| 2 | female | group B | master's degree | standard | none | 90 | 95 | 93 |
| 3 | male | group A | associate's degree | free/reduced | none | 47 | 57 | 44 |
| 4 | male | group C | some college | standard | none | 76 | 78 | 75 |
missing_values=df.isnull().sum()
missing_values=missing_values[missing_values>0]
missing_values
Series([], dtype: int64)
df.dtypes
gender                         object
race/ethnicity                 object
parental level of education    object
lunch                          object
test preparation course        object
math score                      int64
reading score                   int64
writing score                   int64
dtype: object
Depending upon the data type, a different type of visualization is possible
| DataType | visualizations |
|---|---|
| Object | Pie , Barchart, Countplot |
| Numerical | Boxplots, Histograms |
df['gender'].value_counts().reset_index()
| index | gender | |
|---|---|---|
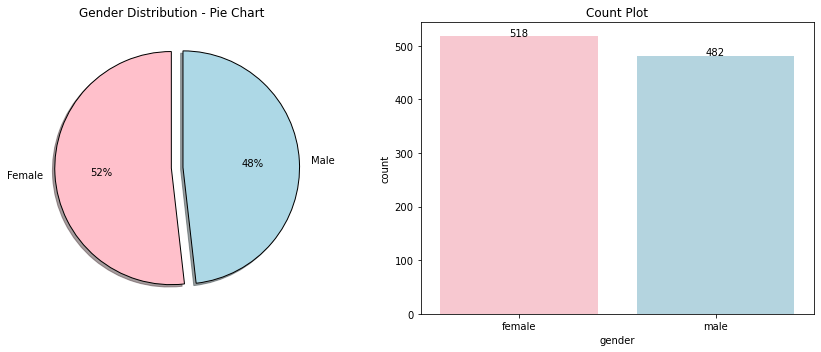
| 0 | female | 518 |
| 1 | male | 482 |
Pie & Count Plot
fig,ax=plt.subplots(1,2,figsize=(12,5))
labels = ['Female', 'Male']
colors = ['pink', 'lightblue']
explode = (0, 0.1)
ax[0].pie(df.gender.value_counts(), startangle=90, colors=colors, wedgeprops={'edgecolor': 'black'}, autopct='%1.f%%',
        explode=explode, shadow=True,labels=labels,)
ax[0].set_title('Gender Distribution - Pie Chart')

sns.countplot(x=df.gender,ax=ax[1],palette=colors)
for idx, row in pd.DataFrame(df['gender'].value_counts().reset_index()).iterrows():
    ax[1].text(idx,row.gender, str(round(row.gender)),color='black', ha="center")
ax[1].set_title("Count Plot")
plt.tight_layout()
plt.show()
d1=pd.crosstab(df["parental level of education"],columns=df.gender,margins=True)
d1
| gender | female | male | All |
|---|---|---|---|
| parental level of education | |||
| associate's degree | 116 | 106 | 222 |
| bachelor's degree | 63 | 55 | 118 |
| high school | 94 | 102 | 196 |
| master's degree | 36 | 23 | 59 |
| some college | 118 | 108 | 226 |
| some high school | 91 | 88 | 179 |
| All | 518 | 482 | 1000 |
d1.sort_values(by='All',ascending=False,inplace=True)
d2=d1.iloc[1:].drop(['All'],axis=1)
d2
| gender | female | male |
|---|---|---|
| parental level of education | ||
| some college | 118 | 108 |
| associate's degree | 116 | 106 |
| high school | 94 | 102 |
| some high school | 91 | 88 |
| bachelor's degree | 63 | 55 |
| master's degree | 36 | 23 |
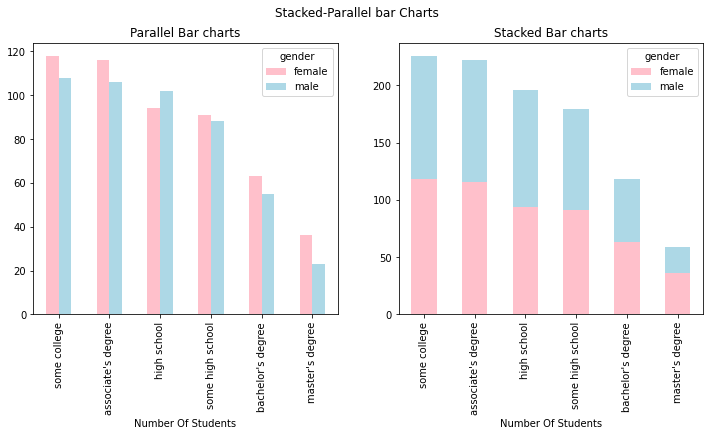
Stacked & Parallel Bar Plot
fig,ax=plt.subplots(1,2,figsize=(12,5))
color_val=['pink','lightblue']
## Parallel bar Chart
d2.plot(kind='bar',ax=ax[0],color=color_val)
ax[0].set_xlabel('Number Of Students')

ax[0].set_title('Parallel Bar charts')

## Stacked bar Chart
d2.plot(kind='bar',ax=ax[1],stacked=True,color=color_val)
ax[1].set_xlabel('Number Of Students')

ax[1].set_title('Stacked Bar charts')
plt.suptitle('Stacked-Parallel bar Charts')
plt.show()
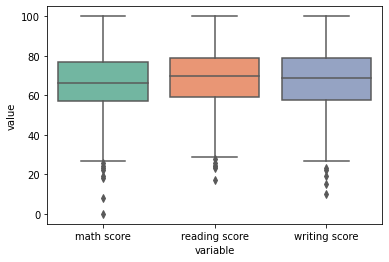
Boxplots
To compare boxplots for columns ,convert them into rows by pandas melt and use it as below
sns.boxplot(x='variable',\
            y='value',\
            data=pd.melt(df[['math score', 'reading score','writing score']],value_vars=['math score', 'reading score','writing score']),\
           palette='Set2')
plt.show()
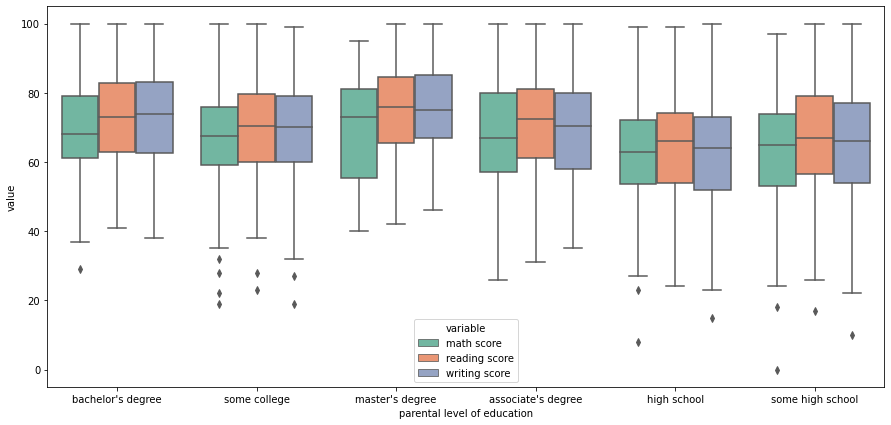
d2=pd.melt(df[["parental level of education",'math score', 'reading score','writing score']],id_vars=["parental level of education"],\
        value_vars=['math score', 'reading score','writing score'])
d2.head()
| parental level of education | variable | value | |
|---|---|---|---|
| 0 | bachelor's degree | math score | 72 |
| 1 | some college | math score | 69 |
| 2 | master's degree | math score | 90 |
| 3 | associate's degree | math score | 47 |
| 4 | some college | math score | 76 |
plt.figure(figsize=(15,7))
sns.boxplot(x='parental level of education',\
            y='value',\
            data=d2,\
            hue='variable',\
           palette='Set2')
plt.show()
num_cols=df.select_dtypes(include=['int64']).columns
ctg_cols=df.select_dtypes(include=['object']).columns

print('Numerical Cols=',num_cols)
print('Categorical Cols=',ctg_cols)
Numerical Cols= Index(['math score', 'reading score', 'writing score'], dtype='object')
Categorical Cols= Index(['gender', 'race/ethnicity', 'parental level of education', 'lunch',
       'test preparation course'],
      dtype='object')
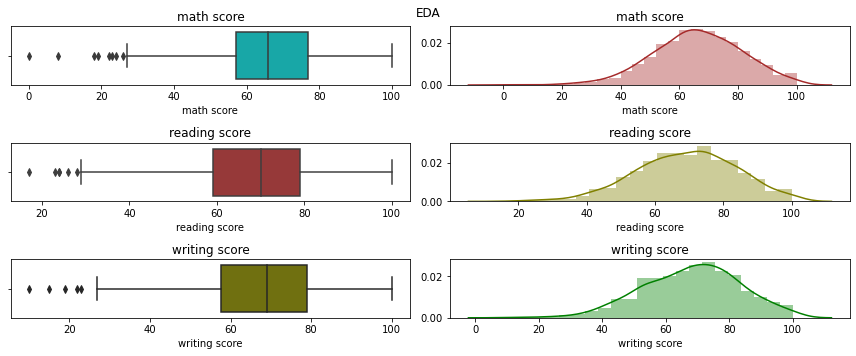
Numerical Data EDA
cols_val=2
fig, ax = plt.subplots(len(num_cols),cols_val,figsize=(12, 5))
colours_val=['c','brown','olive','g','y','p','m']
did_not_ran=True
for i,col in enumerate(num_cols):
    for j in range(cols_val):
        if did_not_ran==True:
            sns.boxplot(df[col],ax=ax[i,j],color=colours_val[i+j])
            ax[i,j].set_title(col)
            did_not_ran=False
        else:
            sns.distplot(df[col],ax=ax[i,j],color=colours_val[i+j])
            ax[i,j].set_title(col)
            did_not_ran=True


plt.suptitle("EDA")
plt.tight_layout()
plt.show()
Generate Sample DataFrame
Below package can be used to generate sample DataFrame. This is just awesome, wow , I’ve wasted so many hours building sample data and this just works so well
It generates a random data set with 30 rows and 4 columns
import pandas as pd
pd.util.testing.makeDataFrame()
D:\Anaconda\lib\site-packages\pandas\util\__init__.py:12: FutureWarning: pandas.util.testing is deprecated. Use the functions in the public API at pandas.testing instead.
  import pandas.util.testing
| A | B | C | D | |
|---|---|---|---|---|
| 2RRJnz2BKY | 0.694925 | 1.449184 | -0.052772 | -0.517751 |
| etS4aLbtbR | 0.011481 | 0.747344 | -0.200567 | -0.778930 |
| ouA6RuAKaV | -0.047707 | -0.087963 | 1.788137 | -1.011278 |
| fz9fRlOmBX | 1.601809 | -0.035541 | -1.103511 | -1.357392 |
| 9LnXmw4Tni | 0.756518 | -0.409933 | 2.830823 | 2.969109 |
| MEj9XmaBEN | -0.174688 | 0.974406 | 0.758869 | -2.270037 |
| RGbM7zeYFo | 0.598896 | -1.929452 | 1.496389 | 1.076925 |
| s2n8E4zYbq | -2.480790 | -0.188385 | 0.864637 | -0.539439 |
| J7AV7WGz86 | -1.233312 | -0.715990 | 0.258828 | 0.591111 |
| Fmsll62iRv | 0.775692 | 0.386384 | -1.309332 | -2.037389 |
| kC6IdAa0pe | -0.579191 | -0.489663 | 0.218062 | 0.367491 |
| yy8a0kKRBm | -1.351233 | -0.291512 | 0.770099 | -0.298295 |
| JzBFp6LyGo | 0.556733 | -1.149342 | -0.328176 | -0.782483 |
| ZUj6MtNnrQ | 1.198531 | -0.322790 | 2.273961 | -0.024317 |
| Vhcf8jYUwm | -0.526784 | 0.185350 | -1.058503 | 0.539276 |
| 2WFULvKiU1 | 0.991055 | 0.340012 | 0.240170 | 1.007916 |
| X9z1L6HUn9 | -0.252113 | 0.475670 | -1.228723 | -1.116394 |
| YISxDqK1iR | 0.423804 | -1.531481 | 0.161626 | -1.327790 |
| rzyxOZnWOi | 1.018998 | 0.401313 | -0.187255 | -0.877379 |
| hqGkD3y0Ht | -0.531509 | -2.345542 | -0.564816 | 1.024513 |
| SuBEchpncr | -0.334761 | 1.645064 | -2.448858 | -0.330884 |
| jsKSdPtFlM | -1.357336 | 0.296029 | 0.039317 | 1.144675 |
| S8D95JiuR4 | 0.545082 | -0.594294 | -0.404269 | -0.637023 |
| SGQKTvOJyl | -0.304923 | 0.779594 | 0.772719 | 0.531959 |
| 1oIga6lP2r | -0.202963 | 1.831511 | -0.050765 | 0.425886 |
| P5xnWTq5nx | 1.474409 | 1.228983 | 1.331954 | -0.721734 |
| 8jFCWjZM2c | -2.559470 | -0.894872 | -1.109342 | 1.573845 |
| 4hV8WFbXg7 | -2.038775 | -0.697973 | 1.123976 | 0.774618 |
| hJZRiVWHO6 | -0.569268 | 0.550622 | -0.356986 | -0.447904 |
| tg2WRbhqYP | -1.530619 | -0.549201 | -0.521094 | -0.922401 |
args & kwargs
def f1(*args):
    """ *args can be one or more"""
    for val in args:
        print(val)
f1(1,2,3,4)
1
2
3
4
def f2(**kwargs):
    """ **kwargs is a dictionary"""
    for key,val in kwargs.items():
        print(key,val)
f2(country='india',capital='delhi',covid_cases=10)
country india
capital delhi
covid_cases 10
Zip unzip
l1=[1,2,3]
l2=[10,12,13]
list(zip(l1,l2))
[(1, 10), (2, 12), (3, 13)]
for i,j in zip(l1,l2):
    print(i,j)
1 10
2 12
3 13
Unzip
z1=zip(l1,l2)
s1,s2=list(zip(*z1))
print(s1,s2)
(1, 2, 3) (10, 12, 13)

Leave a comment